一直以来都想学以致用,拿Yu Vision开刀,试试爬虫。捣鼓了好几天,总算是简单的爬了一下。比如总文章,年发表文章。目前,共发表了155篇posts。
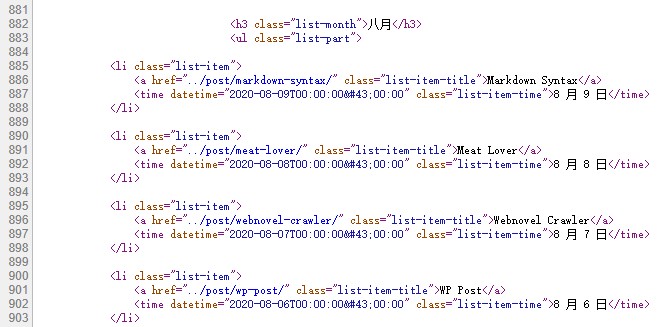
爬虫的核心就是找规律,找到你想爬的内容,然后根据标签和相关规律提取所需内容。只要是在网页上的内容,或多或少都可以通过HTML的源代码获取到一定的信息。比如这次我就想把Post的名字都爬出来,打开Post源代码。可以观察到Post的标题信息在class="list-item-title"当中,然后Post的发表时间在time datetime=''当中。因此通过强大的BeautifulSoup,可以提取出想要的信息。

提取标题的代码可见:
|
|
同理,可以提取出Post的发表时间和年。但是值得注意的是,需要对时间进行标准化转化为后期处理做准备。
|
|
接下来,将Post,Year,Date这三列信息整合到Dataframe当中。
|
|
安装了tabulate后,可以将表格以markdown的格式输出。截止到2020/08/09,共有155篇Posts。表格如下:
| Post | Year | Date | |
|---|---|---|---|
| 0 | 大家好,我是小宇 | 2015 | 05-25 |
| 1 | 台北印象 | 2015 | 05-29 |
| 2 | 花莲 | 2015 | 06-04 |
| 3 | 南京聚会 | 2015 | 06-11 |
| 4 | 阿里山 | 2015 | 06-28 |
| 5 | 绿岛 | 2015 | 06-28 |
| 6 | 台南和高雄 | 2015 | 06-28 |
| 7 | Flight Travel | 2015 | 09-04 |
| 8 | Eating | 2015 | 09-07 |
| 9 | Study in Houghton | 2015 | 11-07 |
| 10 | Cooking at home | 2015 | 12-21 |
| 11 | 2015 Christmas trip | 2015 | 12-31 |
| 12 | My 2015 | 2016 | 01-01 |
| 13 | Houghton’s winter | 2016 | 03-28 |
| 14 | Changing | 2016 | 04-23 |
| 15 | Birthday Dinner | 2016 | 06-04 |
| 16 | Moving to a new place | 2016 | 07-01 |
| 17 | How to get a drive licence in Michigan, USA | 2016 | 07-04 |
| 18 | Life is about choices and the decisions we make | 2016 | 07-15 |
| 19 | 2016 Utah Driving Trip (Day 3) | 2016 | 08-28 |
| 20 | 2016 Utah Driving Trip (Day 2) | 2016 | 08-28 |
| 21 | 2016 Utah Driving Trip (Day 1) | 2016 | 08-28 |
| 22 | 2016 Utah Driving Trip (Day 4) | 2016 | 09-03 |
| 23 | 2017 | 2017 | 01-05 |
| 24 | Go Skiing | 2017 | 02-05 |
| 25 | Printing | 2017 | 03-18 |
| 26 | MTU Trails | 2017 | 05-08 |
| 27 | Mountain bike experience | 2017 | 05-13 |
| 28 | Rowing | 2017 | 09-20 |
| 29 | Daily Life | 2017 | 09-23 |
| 30 | Purpose of life | 2017 | 10-29 |
| 31 | Another Time | 2017 | 11-12 |
| 32 | Why Work | 2017 | 11-20 |
| 33 | Be Thankful | 2017 | 11-25 |
| 34 | Trade off | 2017 | 12-03 |
| 35 | Day one Skiing | 2017 | 12-11 |
| 36 | Cellphone vs Smartphone | 2017 | 12-11 |
| 37 | 2017 Back China | 2018 | 01-25 |
| 38 | Spicy Food | 2018 | 02-12 |
| 39 | 2018 Chinese New Year | 2018 | 02-14 |
| 40 | Yu Vision | 2018 | 04-28 |
| 41 | Donuts and Coffee | 2018 | 04-30 |
| 42 | I have a question | 2018 | 05-05 |
| 43 | Graduation? Not me | 2018 | 05-05 |
| 44 | Houghton | 2018 | 05-06 |
| 45 | To Lansing | 2018 | 05-10 |
| 46 | Food in Lansing | 2018 | 05-11 |
| 47 | Learn to Swim | 2018 | 05-20 |
| 48 | Back To Trail | 2018 | 05-26 |
| 49 | A Jack of all trades | 2018 | 06-02 |
| 50 | Gaokao | 2018 | 06-10 |
| 51 | Flash Flood | 2018 | 06-17 |
| 52 | Shopping Day | 2018 | 06-24 |
| 53 | Oil Change | 2018 | 07-01 |
| 54 | Houghton Cycling | 2018 | 07-08 |
| 55 | Milky Way | 2018 | 07-14 |
| 56 | Sell a Car | 2018 | 07-29 |
| 57 | One Week in Kalamazoo | 2018 | 08-12 |
| 58 | New Biking Route | 2018 | 08-18 |
| 59 | Fitzgerald’s Restaurant | 2018 | 08-26 |
| 60 | Brockway Mountain | 2018 | 09-09 |
| 61 | Life is a journey | 2018 | 09-15 |
| 62 | Downstate, One More Time | 2018 | 09-23 |
| 63 | M-26 | 2018 | 10-07 |
| 64 | 2018 U.P. Fall | 2018 | 10-14 |
| 65 | Stressful Workdays | 2018 | 10-21 |
| 66 | Nara Park | 2018 | 10-28 |
| 67 | Winter Comes | 2018 | 11-11 |
| 68 | Thanksgiving | 2018 | 11-22 |
| 69 | When to write | 2018 | 11-24 |
| 70 | Time | 2018 | 12-02 |
| 71 | Same Date | 2018 | 12-09 |
| 72 | Dongzhi Festival | 2018 | 12-22 |
| 73 | Beach and Sunshine | 2019 | 01-03 |
| 74 | Tampa | 2019 | 01-05 |
| 75 | Atlanta | 2019 | 01-06 |
| 76 | Food at FL and GA | 2019 | 01-11 |
| 77 | DC Trip | 2019 | 01-20 |
| 78 | Cross-country Skiing | 2019 | 01-27 |
| 79 | Chinese New Year | 2019 | 02-04 |
| 80 | XC Skiing | 2019 | 02-19 |
| 81 | Blizzard | 2019 | 02-24 |
| 82 | 10k | 2019 | 03-10 |
| 83 | “Annual” Shopping | 2019 | 03-24 |
| 84 | The 135th | 2019 | 04-04 |
| 85 | Sport Activities Analysis | 2019 | 04-07 |
| 86 | Food in North TX | 2019 | 04-14 |
| 87 | Two Museums | 2019 | 04-21 |
| 88 | Smooth Operator | 2019 | 04-28 |
| 89 | Class 2019 | 2019 | 05-05 |
| 90 | Cold As Usual | 2019 | 05-12 |
| 91 | Nicknames | 2019 | 05-19 |
| 92 | Soldering | 2019 | 05-25 |
| 93 | Memorial Day | 2019 | 05-27 |
| 94 | Road Cycling No1 | 2019 | 06-09 |
| 95 | Road Cycling No2 | 2019 | 06-16 |
| 96 | Road Cycling No3 | 2019 | 06-22 |
| 97 | Road Cycling No4 | 2019 | 06-30 |
| 98 | Road Cycling No5 | 2019 | 07-07 |
| 99 | Ann Arbor | 2019 | 07-28 |
| 100 | Near Chicago | 2019 | 08-04 |
| 101 | Downtown Chicago | 2019 | 08-18 |
| 102 | Road Cycling No6 | 2019 | 08-25 |
| 103 | Road Cycling No7 | 2019 | 09-01 |
| 104 | A Glimpse of Fall | 2019 | 09-08 |
| 105 | 6k run | 2019 | 09-15 |
| 106 | Sailing 101 (Part A) | 2019 | 09-22 |
| 107 | Road Cycling No8 | 2019 | 09-29 |
| 108 | Sailing 101 Part B | 2019 | 10-20 |
| 109 | Frost | 2019 | 11-03 |
| 110 | Pre-thanksgiving winter storm | 2019 | 11-28 |
| 111 | IP6 Battery Replacement | 2019 | 11-30 |
| 112 | Downhill No1 | 2019 | 12-08 |
| 113 | Final Week | 2019 | 12-22 |
| 114 | Year of 2019 | 2019 | 12-31 |
| 115 | DC 2020 | 2020 | 01-19 |
| 116 | 2020 XC Skiing | 2020 | 02-02 |
| 117 | Duluth Visiting | 2020 | 02-13 |
| 118 | Duluth Downhill | 2020 | 02-15 |
| 119 | Duluth Food | 2020 | 02-22 |
| 120 | Feb Skis | 2020 | 02-29 |
| 121 | Giant Loop | 2020 | 03-18 |
| 122 | Downhill | 2020 | 03-22 |
| 123 | Stay Home | 2020 | 03-30 |
| 124 | XC Skis | 2020 | 04-01 |
| 125 | Hybrid Route | 2020 | 04-12 |
| 126 | Note 1 | 2020 | 04-20 |
| 127 | Social Distancing | 2020 | 04-28 |
| 128 | Note 2 | 2020 | 04-30 |
| 129 | Deers & Trails | 2020 | 05-14 |
| 130 | Note 3 | 2020 | 05-19 |
| 131 | May | 2020 | 05-24 |
| 132 | Note 4 | 2020 | 05-25 |
| 133 | The Shell | 2020 | 06-05 |
| 134 | Note 5 | 2020 | 06-06 |
| 135 | JS Basics | 2020 | 06-14 |
| 136 | One Line Code | 2020 | 06-17 |
| 137 | Web Updates | 2020 | 06-18 |
| 138 | Note 6 | 2020 | 06-20 |
| 139 | Bike Sale | 2020 | 06-26 |
| 140 | Old Photos | 2020 | 06-28 |
| 141 | Note 7 | 2020 | 07-01 |
| 142 | Swimming | 2020 | 07-04 |
| 143 | 2012-2015 Old Photos | 2020 | 07-11 |
| 144 | NEOWISE | 2020 | 07-13 |
| 145 | Cavity2d | 2020 | 07-31 |
| 146 | Unit Conversion | 2020 | 08-01 |
| 147 | Encode and Decode | 2020 | 08-02 |
| 148 | 2D CBC | 2020 | 08-03 |
| 149 | Douban Spider | 2020 | 08-04 |
| 150 | 3D CBC | 2020 | 08-05 |
| 151 | WP Post | 2020 | 08-06 |
| 152 | Webnovel Crawler | 2020 | 08-07 |
| 153 | Meat Lover | 2020 | 08-08 |
| 154 | Markdown Syntax | 2020 | 08-09 |
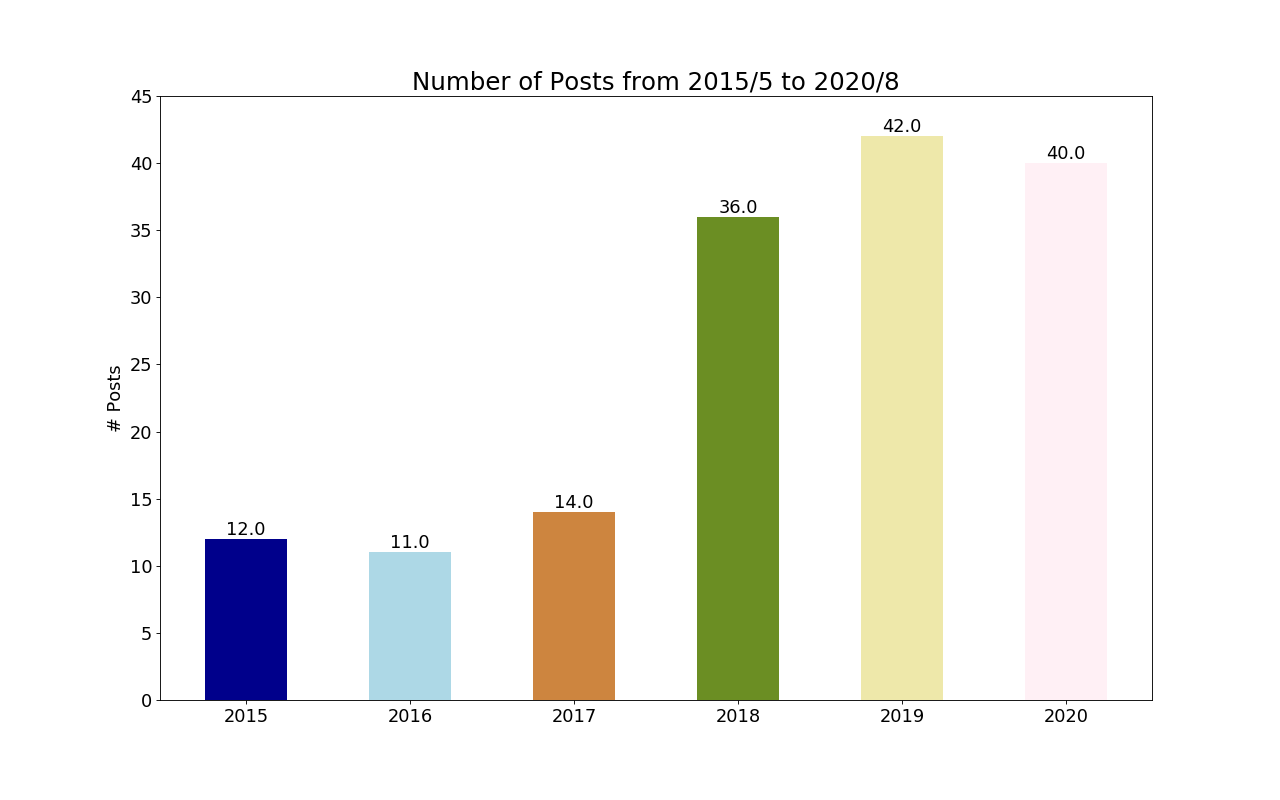
最后,观察一下每年发表的Post,利用python里面的matplotlib:
|
|
从图中可看出,从懒惰的2015-2017,然后年发表文章数逐年上升,目前在年文章36篇左右。也就是说10天一次的更新频率。

继续加油吧,慢慢水Post~~
附上源代码:
|
|