Swimming is one of my favorite sports.
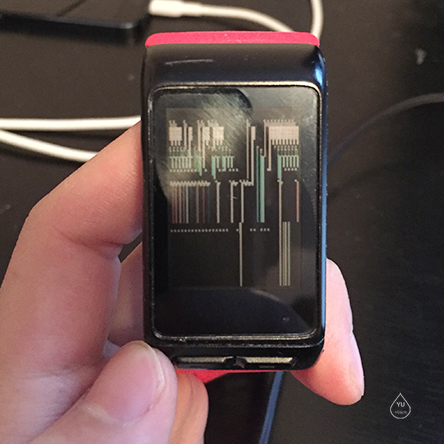
I had a sport watch and I used it to record my swimming activity. I used it during swimming for 134 times. In the 135th swimming, the water infiltrated into the watch and the watch is not working now.
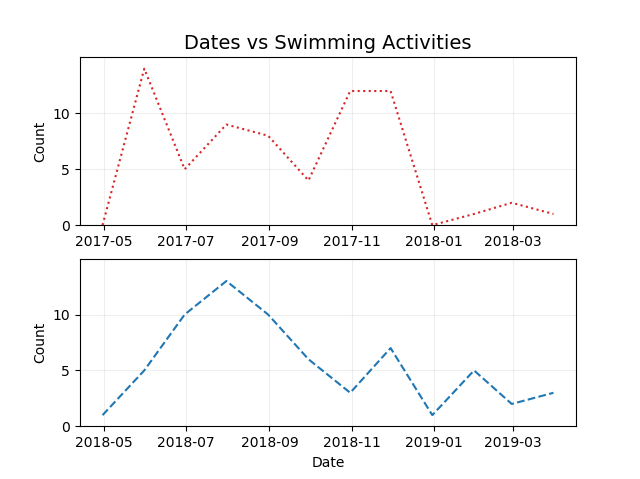
Looking at the data, I swam 134 times from May, 2017 to March 2019. It means I swam 1~2 times per week in the past two years. The total distance was 116.8 mile, which more than a one way distance from campus to Tjmaxx, Marquette. The total activity time is 80.3 hours, which means I used at 36 mins for each recored activity.
| Type | Swimming |
|---|---|
| Activities | 134 |
| Total Distance | 116.8 mile |
| Total Activity Time | 80.3 h |
| Average Speed | 1.5 mph |
In details, I swam more often during summer time, probably summer time is a good season for swimming. In terms of winter, it may too cold or I went to skiing.
From April, 2017 to March, 2019:
The python code to plot this figure was showed as the following:
|
|
Well, look at the watch at last. The pixels messed up...